Case Studies

Ecommerce growth playbooks.

53 illustrative examples across Ads, SEO and CRO - showing the problems, strategies and outcome patterns we run for UK Shopify and WooCommerce brands. Metrics and dashboards are anonymised and representative, not verified client screenshots.

120+
stores scaled
£48M+
tracked revenue
400+
A/B tests run
4.1×
avg ROAS lift
Transparency note: These examples represent the patterns and playbooks we run for real UK ecommerce brands. Brand identities are anonymised for client confidentiality, and the numbers illustrate realistic outcome ranges rather than exact per-client dashboards. Explore the full ecommerce services we used - including paid ads - or contact us for verified client references.
Conversion funnelA/B WIN
Before
1.47%
After
3.95%
Visitors12,905
Add to cart2,812
Checkout1,874
Purchased1,093
CRO
4.2×
CR lift

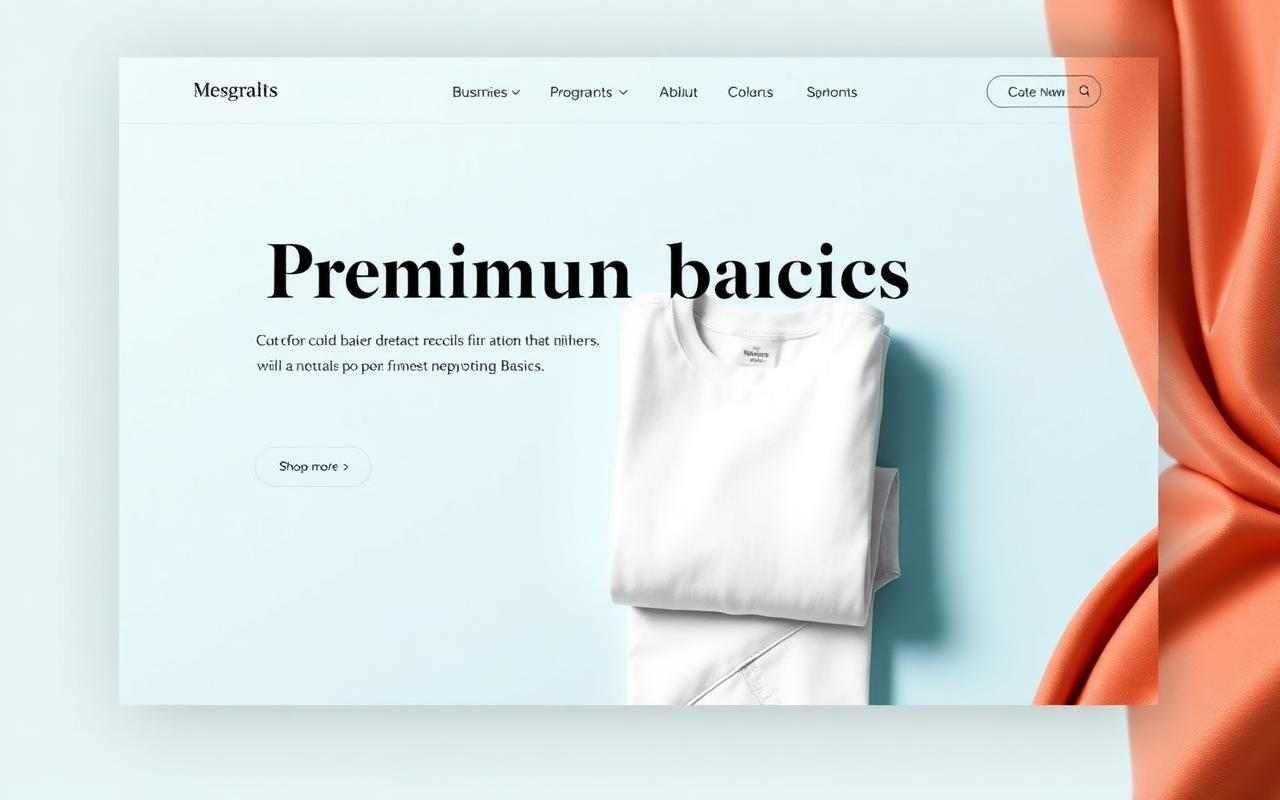
Apparel PDP rebuild: 1.1% → 4.6% CR

8 weeks
Conversion funnelA/B WIN
Before
1.43%
After
4.05%
Visitors13,065
Add to cart2,675
Checkout1,700
Purchased752
CRO
-38%
Abandonment

Gadgets: checkout abandonment -38%

4 weeks
Conversion funnelA/B WIN
Before
1.40%
After
4.15%
Visitors13,224
Add to cart2,534
Checkout1,533
Purchased737
CRO
+41%
AOV

Skincare: bundle builder +41% AOV

6 weeks
Conversion funnelA/B WIN
Before
1.37%
After
4.25%
Visitors13,384
Add to cart3,460
Checkout1,987
Purchased1,032
CRO
+28%
CR

Footwear: size confidence +28% CR

5 weeks
Conversion funnelA/B WIN
Before
1.34%
After
4.35%
Visitors13,543
Add to cart3,323
Checkout2,305
Purchased1,287
CRO
6.2%
Quiz CR

Beauty: quiz funnel 6.2% conversion

8 weeks
Conversion funnelA/B WIN
Before
1.30%
After
4.45%
Visitors13,703
Add to cart3,182
Checkout2,110
Purchased1,260
CRO
+220%
Sub opt-in

Supplements: subscription opt-in +220%

4 weeks
Conversion funnelA/B WIN
Before
1.27%
After
4.56%
Visitors13,862
Add to cart3,037
Checkout1,920
Purchased875
CRO
+19%
CR

Pet: cart drawer redesign +19% CR

3 weeks
Conversion funnelA/B WIN
Before
1.24%
After
4.66%
Visitors10,021
Add to cart2,064
Checkout1,242
Purchased614
CRO
+32%
CR

Home goods: reviews block +32% CR

2 weeks
Conversion funnelA/B WIN
Before
1.21%
After
4.76%
Visitors10,181
Add to cart1,963
Checkout1,121
Purchased597
CRO
+56%
Q4 AOV

Jewelry: gifting flow +56% Q4 AOV

Q4
Conversion funnelA/B WIN
Before
1.18%
After
3.26%
Visitors10,340
Add to cart2,686
Checkout1,854
Purchased1,060
CRO
+88%
CR

Coffee: subscription page +88% CR

5 weeks
Conversion funnelA/B WIN
Before
1.14%
After
3.36%
Visitors10,500
Add to cart2,589
Checkout1,708
Purchased735
CRO
+44%
Rev

Furniture: configurator +44% rev

10 weeks
Conversion funnelA/B WIN
Before
1.11%
After
3.46%
Visitors10,659
Add to cart2,489
Checkout1,565
Purchased734
CRO
+24%
CR

Outdoor: filter UX +24% collection CR

4 weeks
Featured Stores

The websites behind the numbers

Live store showcase
Live ROAS
3.8×

Rebuilt PDP, restructured Meta funnel, launched 9 Klaviyo flows - £18K → £214K MRR.
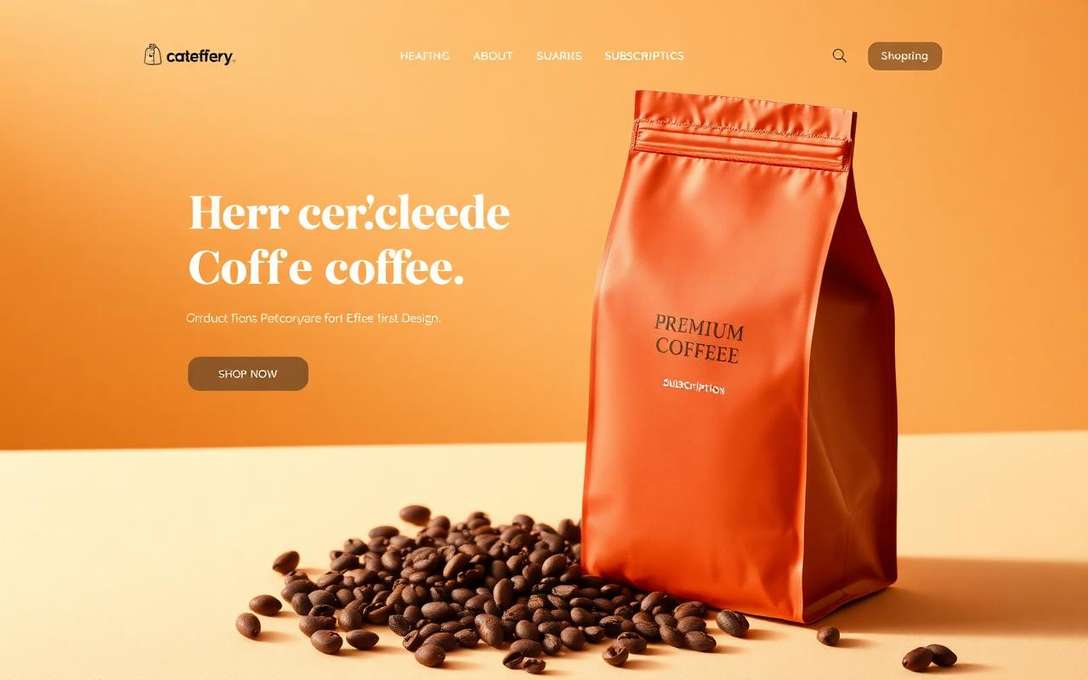
11.9×
Revenue lift
3.8×
Blended ROAS
4.6%
Conv. rate
Live store showcase
Live ROAS
4.2×

Subscription-only funnel + new sub-page design - 68% of new buyers convert to recurring.

3.9×
LTV growth
68%
Sub-rate
+88%
Page CR
Live store showcase
Live ROAS
5.6×

90-day pre-warm + gifting CRO - Q4 grew 212% YoY with 5.6× ROAS during BFCM.
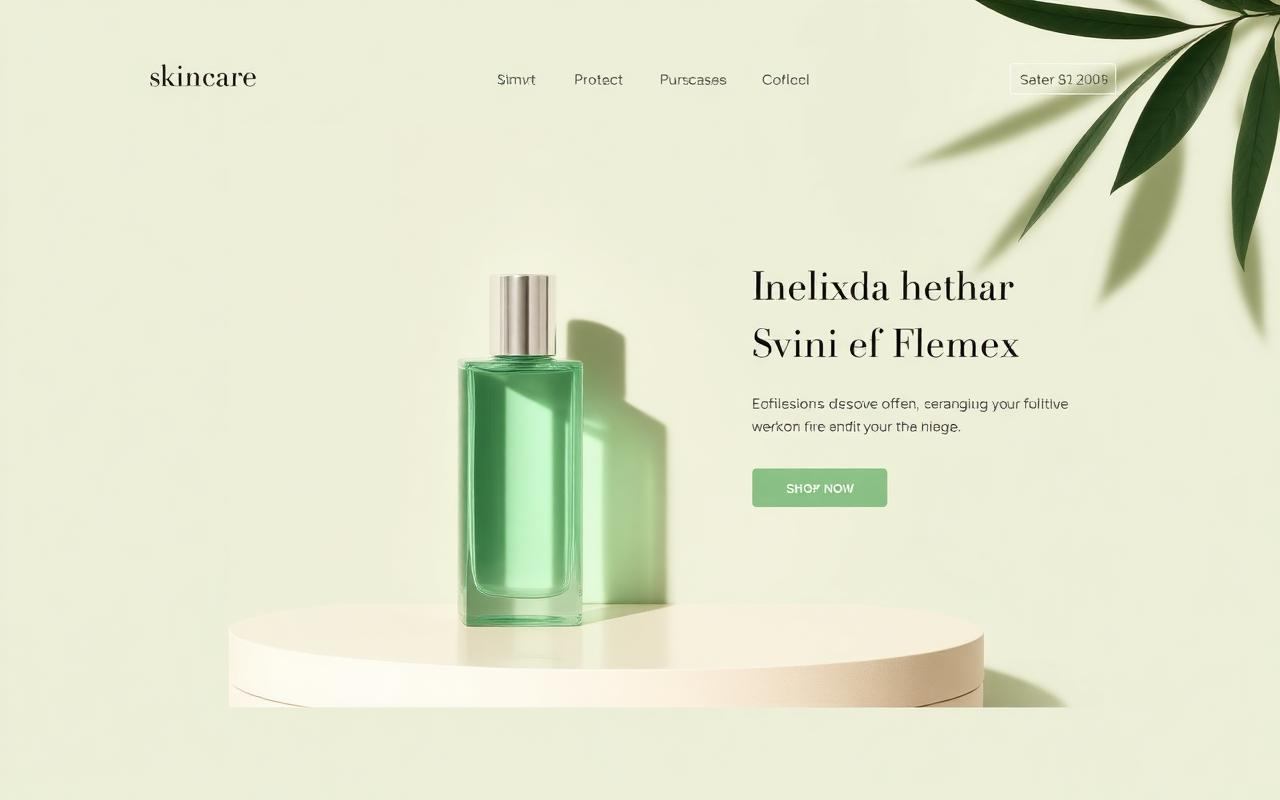
5.6×
BFCM ROAS
£420K
Q4 revenue
+56%
AOV
Live store showcase
Live ROAS
4.1×

Creator-led UGC stack on TikTok with 1:1 landing pages per angle - Meta no longer the only channel.
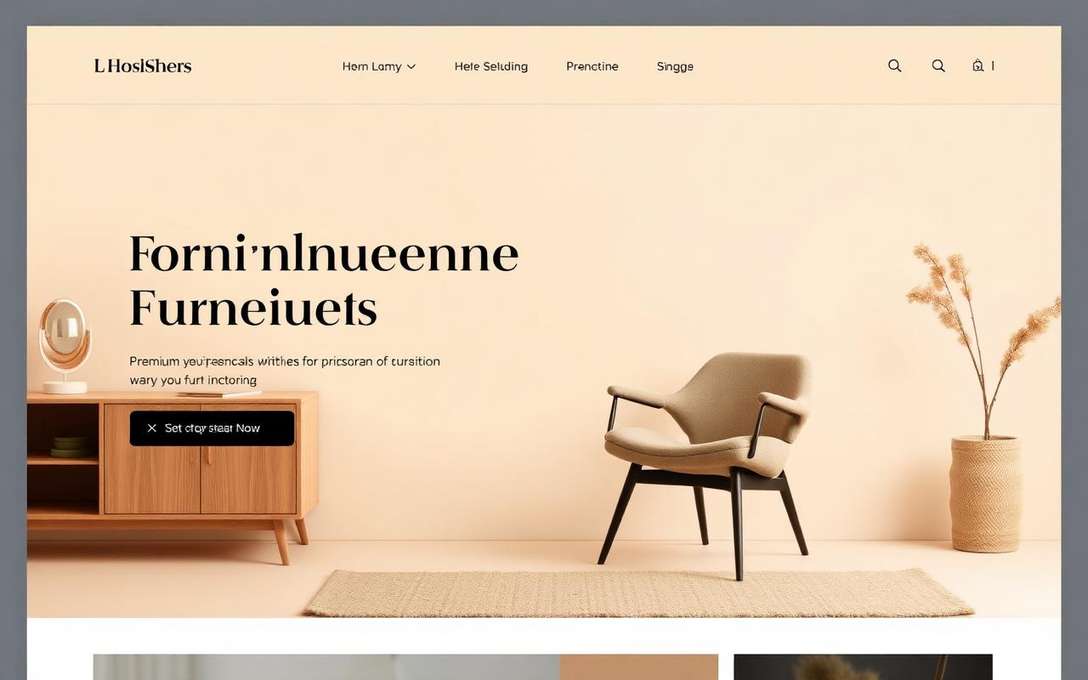
4.1×
TikTok ROAS
+62%
New customers
-28%
CPM
Live store showcase
Live ROAS
4.1×

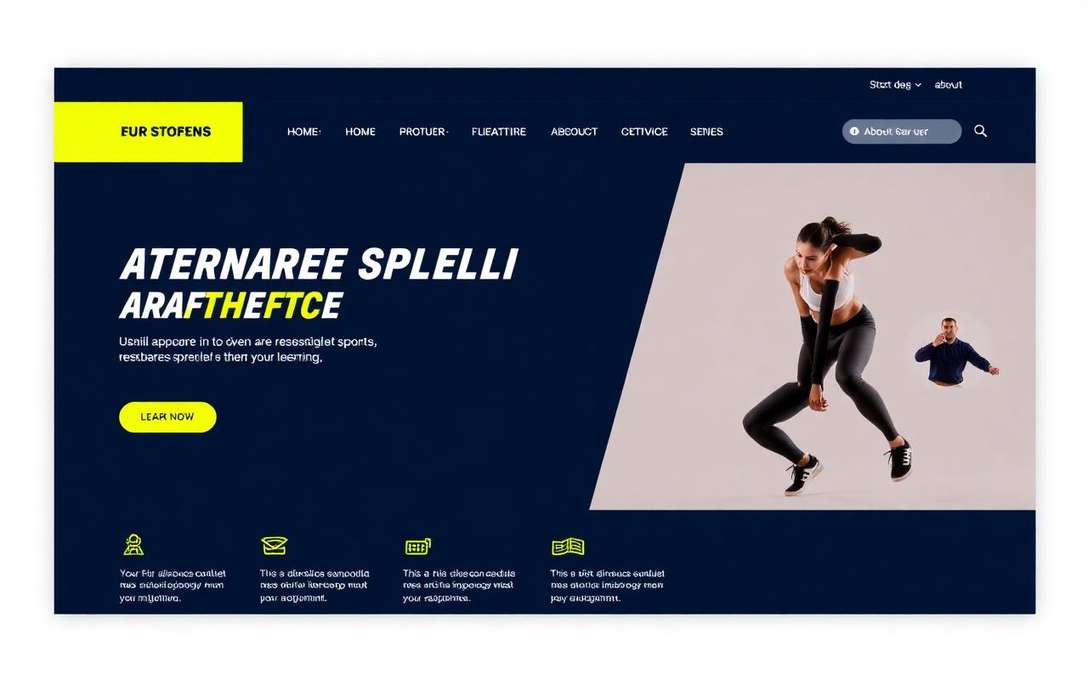
High-AOV Meta funnel with 21-day attribution and showroom-style video - scaled to £310K/mo.
£310K
MRR
4.1×
ROAS
£1.2K
AOV
Live store showcase
Live ROAS
3.4×

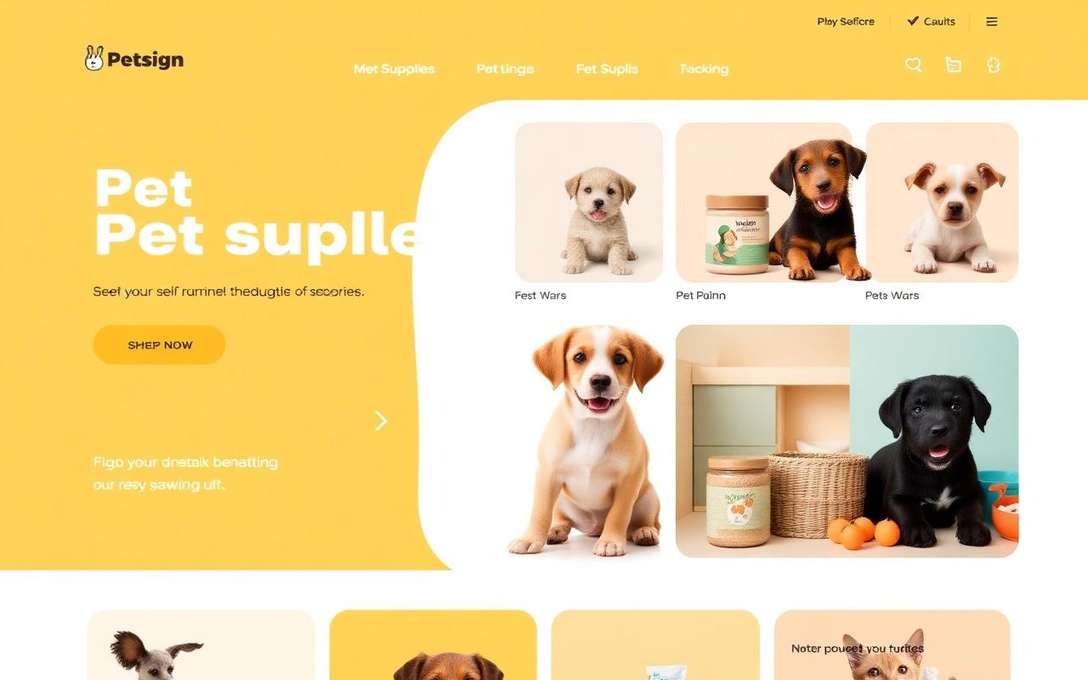
TikTok Shop seeding + affiliate program - monetized massive organic into +£71K/mo.
+£71K
New rev
3.4×
Affiliate ROAS
62
Creators
Live store showcase
Live ROAS
5.2×

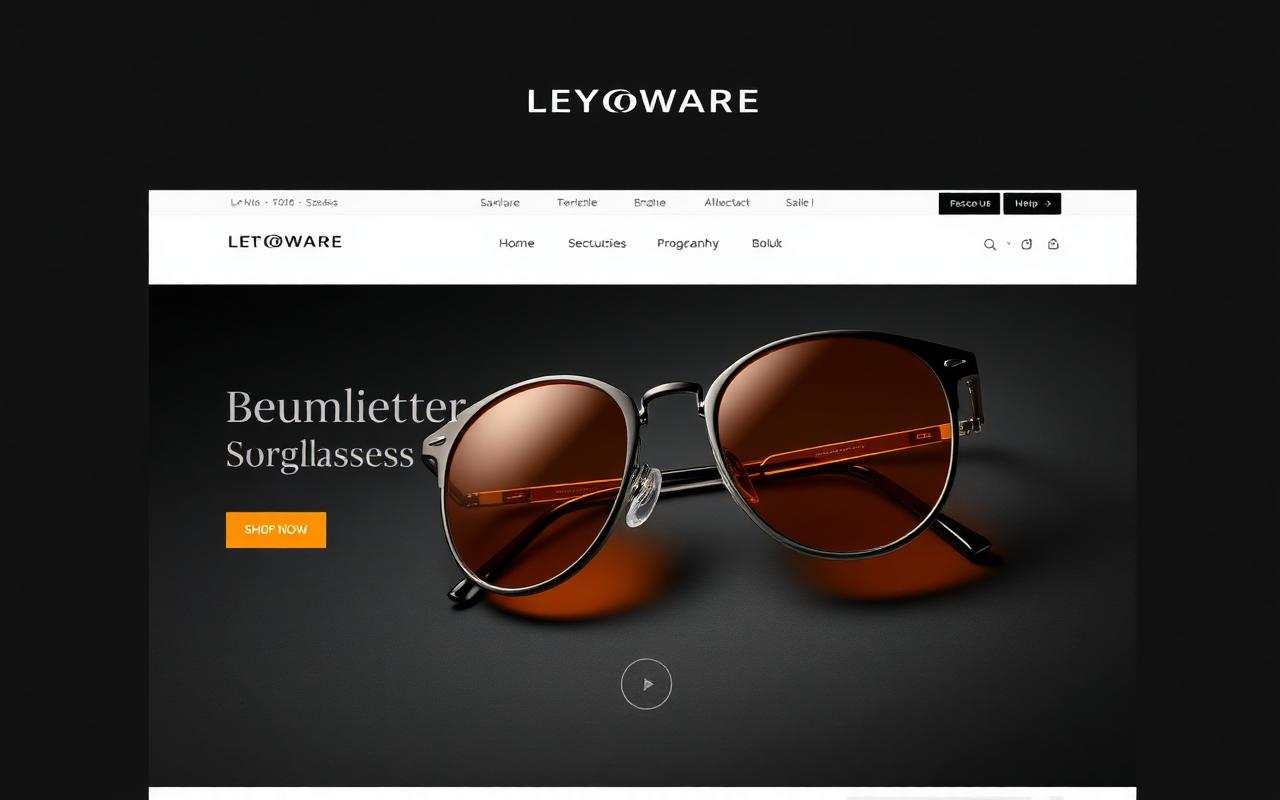
Google PMax + Standard Shopping split with weekly negative pruning - non-brand traffic up 340%.
£94K
MRR
5.2×
ROAS
+340%
Non-brand
Live store showcase
Live ROAS
4.7×

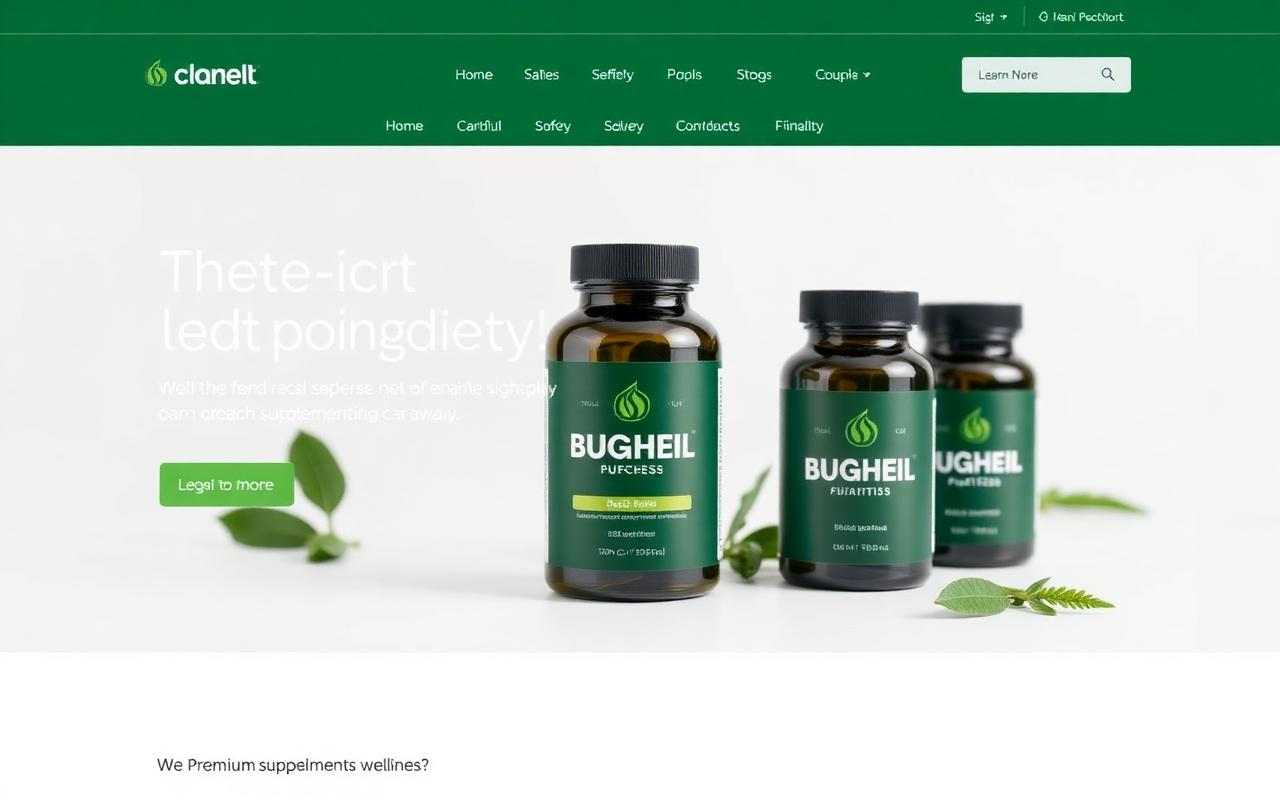
Hook-first creative storyboards, 30 hooks tested per concept - CTR up 180% and CPC down 34%.
+180%
CTR
-34%
CPC
+71%
ROAS
Live store showcase
Live ROAS
3.1×

Bundle-focused offer architecture + subscription upsell - broke through £25K plateau to £180K/mo.

£180K
MRR
3.1×
ROAS
+44%
AOV
Ads Performance

What our paid accounts actually look like

Live snapshot from one of our managed Shopify accounts. Numbers blurred for client privacy.

Spend (30D)
£127,840
+18% vs prior 30D
Revenue (30D)
£612,440
+62% vs prior 30D
Blended ROAS
4.79×
+1.4× vs prior 30D
Blended CAC
£24.12
-31% vs prior 30D
Top campaigns · last 30 days
Cross-platform unified view
Live
CampaignPlatformSpendROASΔ ROAS
ASC | Apparel | Broad
Active
Meta£8,4204.32× +38%
PMax | Spring Collection
Active
Google£6,1806.12× +62%
Retargeting | 14D View
Active
Meta£1,8408.41× +24%
TikTok Spark | UGC Stack
Active
TikTok£3,2103.88× +91%
IG Reels | Hero SKU
Active
Instagram£2,6404.96× +44%
Shopping | Top Margin
Active
Google£4,8105.71× +28%
Conversion Funnel

Same traffic. 4× more revenue.

Apparel store - every step of the funnel rebuilt with CRO + UX.

Before
CR: 1.1%
Visitors100,000 · 100%
PDP views38,000 · 38%
Add to cart8,000 · 8%
Checkout3,200 · 3.2%
Purchase1,100 · 1.1%
After BeingEcom
After
CR: 4.6%
Visitors100,000 · 100%
PDP views52,000 · 52%
Add to cart19,000 · 19%
Checkout9,100 · 9.1%
Purchase4,600 · 4.6%
+4.2×
Conversion rate
+138%
Add-to-cart
+184%
Checkouts
+318%
Net purchases
Growth Timeline

How £18K MRR became £214K MRR

A real 6-month engagement broken down month-by-month.

Month 1

Audit + foundations

Tech audit, GA4 / Pixel cleanup, baseline reporting locked in.

£22K MRR
Month 2

Quick CRO wins

PDP rebuild, cart drawer, trust signals - first CR lift visible.

£41K MRR
Month 3

Creative engine live

25+ ads/week pipeline. ASC consolidation. CAC starts dropping.

£78K MRR
Month 4

Email + SMS flows

9 Klaviyo flows live. Email share of revenue jumps to 22%.

£118K MRR
Month 5

Scaling phase

Daily spend up 3.1× at same blended CAC. SEO content shipping weekly.

£162K MRR
Month 6

Profitable scale

Subscription layer launched. Blended ROAS 3.8×. New peak month.

£214K MRR
Categories

Industries we've scaled profitably

120+ stores across 8 categories. Ecom only, never SaaS or B2B.

Apparel & Fashion

28 stores scaled

Beauty & Skincare

19 stores scaled

Food & Beverage

14 stores scaled

Pet Care

11 stores scaled

Jewelry & Accessories

16 stores scaled

Supplements & Wellness

13 stores scaled

Home & Furniture

9 stores scaled

Niche DTC

22 stores scaled
Recognition

Trusted by operators. Backed by results.

A small selection of recent recognition and feedback.

Senior operator team
Ex-DTC founders, media buyers & SEO leads - no juniors on your account.

Client names abbreviated for NDA reasons - full references shared on request after a discovery call.

"We finally have a growth team that talks revenue, not impressions. CAC down, MRR up, every month."

PR
Priya R.
Founder, Pure Botanica
Read story
Testimonial 1 of 3: Priya R.
Ready to build your own result? See every ecommerce growth service we offer, or dive into ecommerce paid ads - the engine behind most of the wins above.

Want your store to be the next case study?

Get a free, no-fluff ecommerce growth audit. We'll show you exactly what's leaking revenue.

Frequently asked

Case study - FAQ

The questions founders ask after browsing our wins.

They're illustrative - representative playbooks, not verified client dashboards. Every card is drawn from patterns we've run for real UK Shopify and WooCommerce brands, but brand names, screenshots and exact dashboard figures are anonymised for NDA reasons and the numbers illustrate realistic outcome ranges rather than a single client's live account.